Footprint Calculation, Reduction & Reporting in less time.
Calculate your Scope 1-3 greenhouse gas emissions.
WHAT YOU GET
Impact in record time.
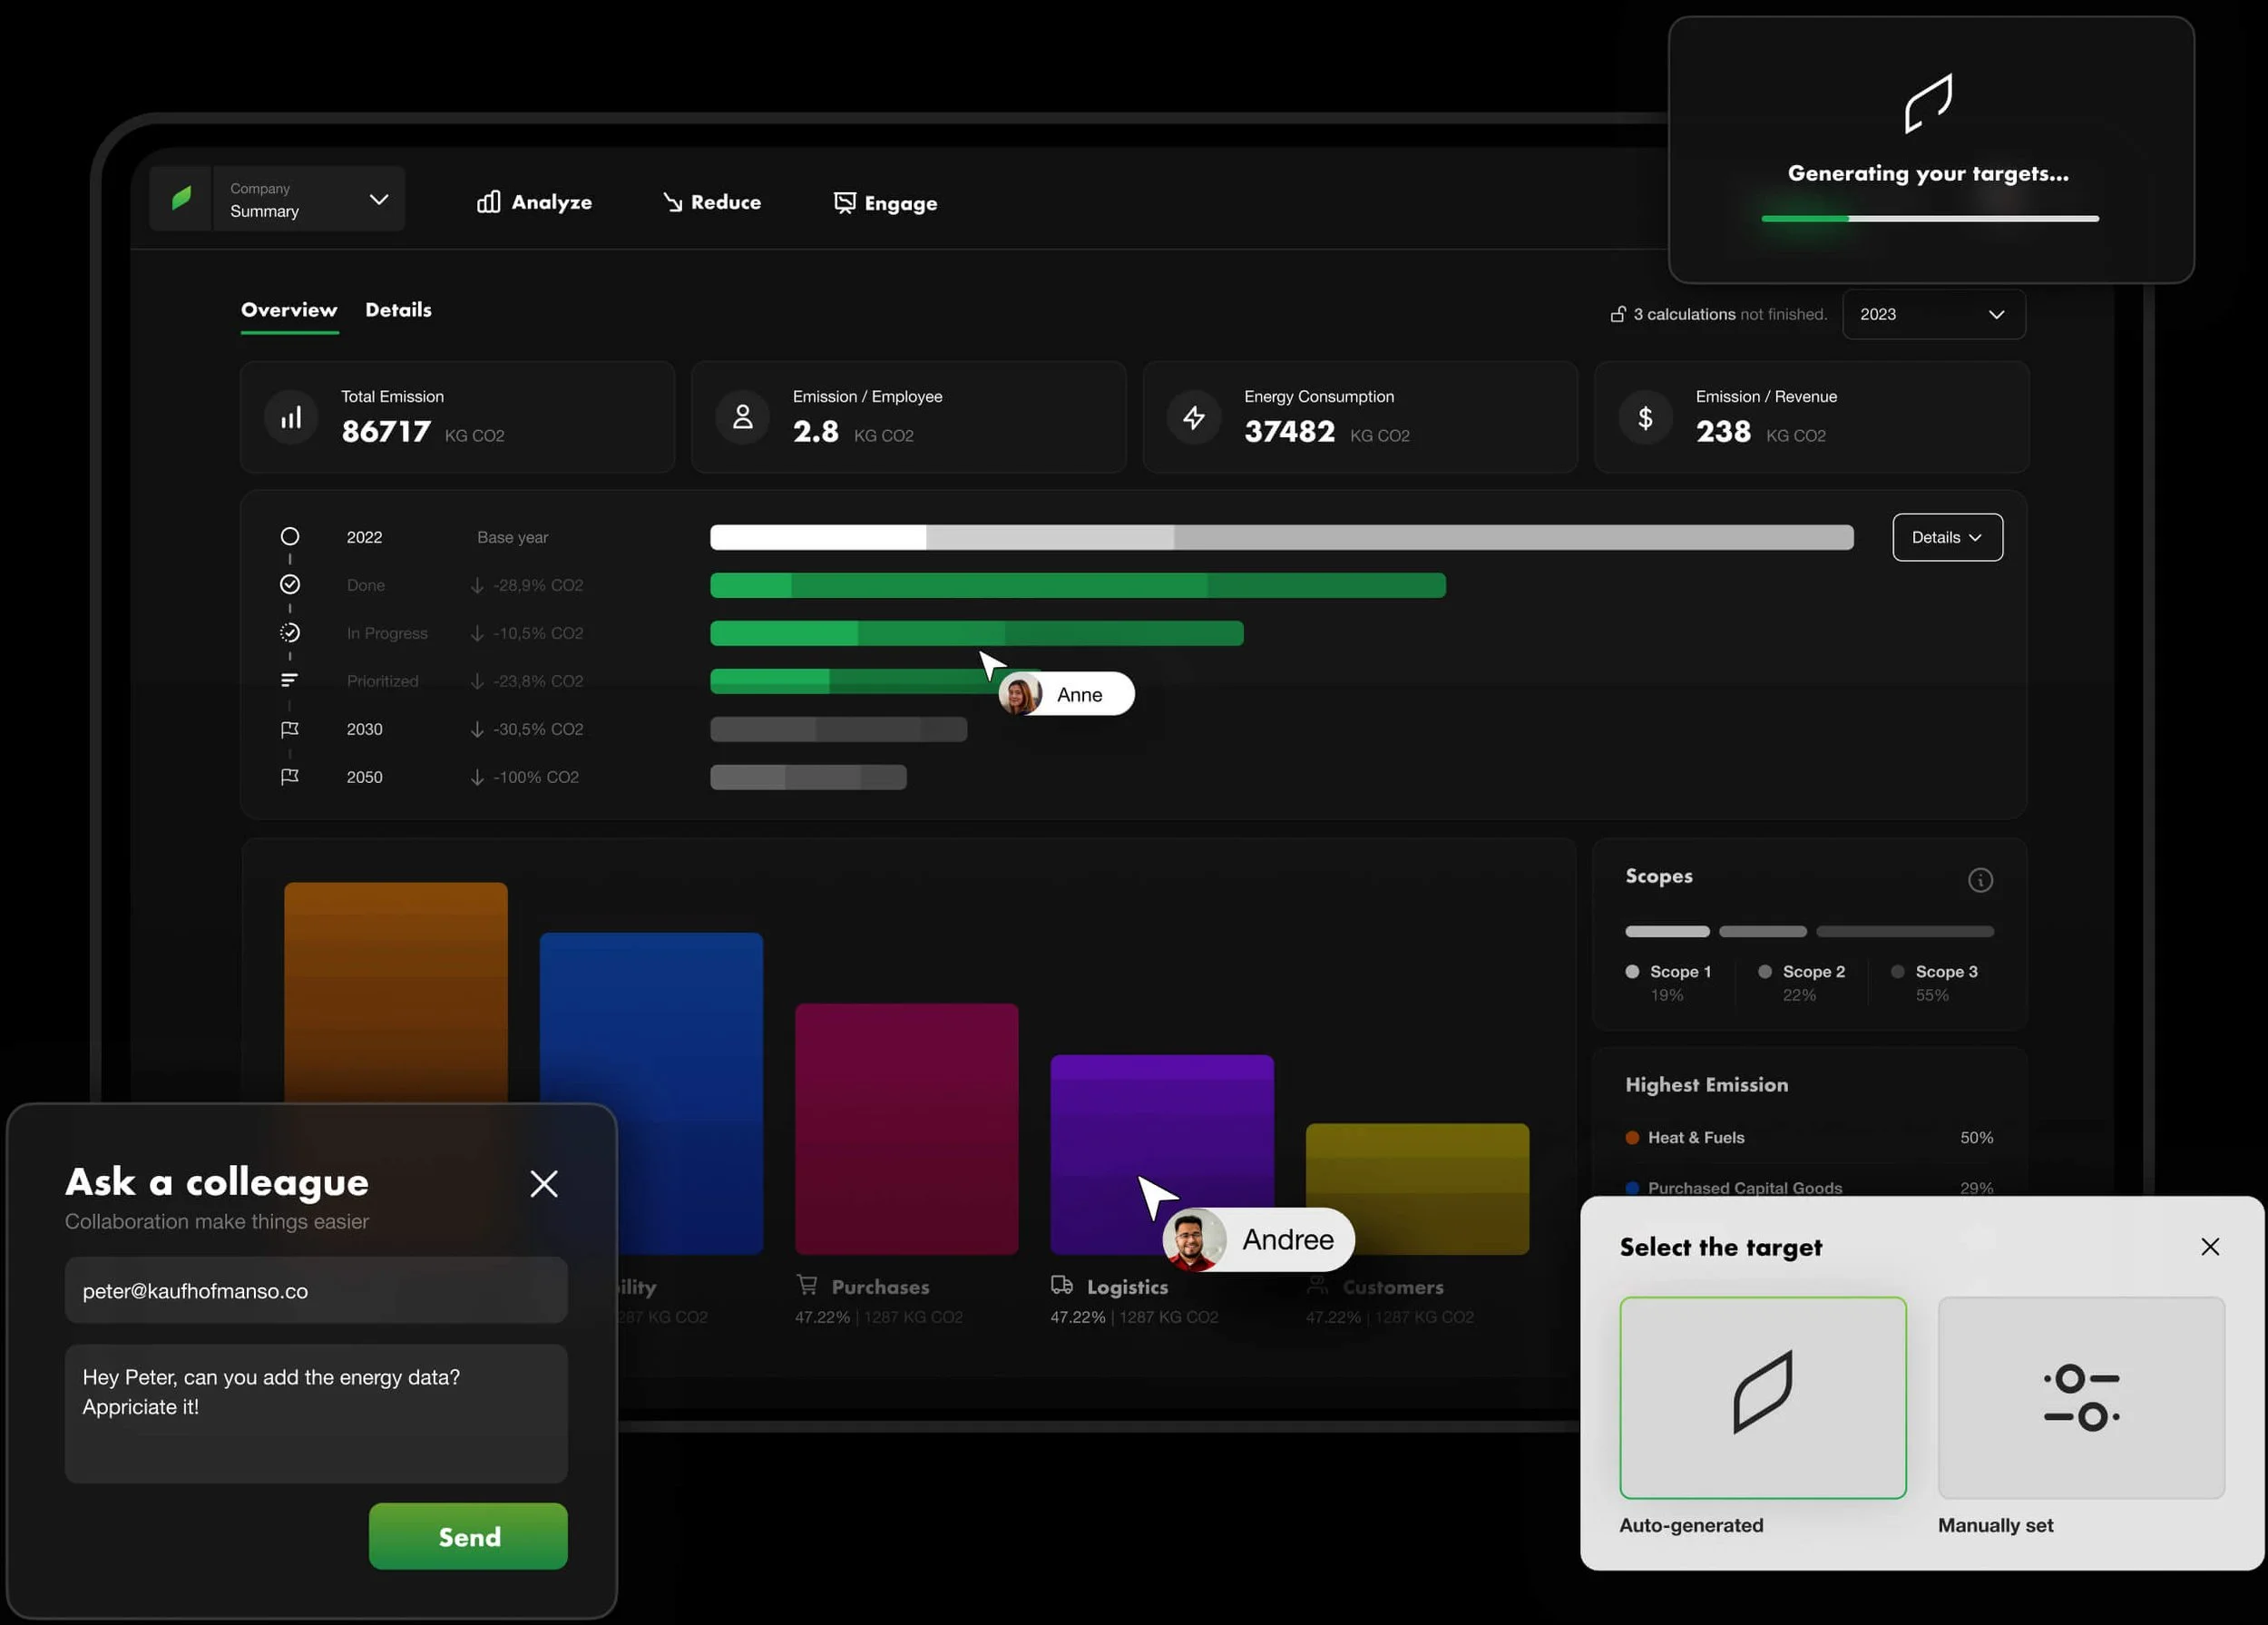
Carbon Emission Profile
CSRD/ESG & Carbon Footprint Calculation of your complete Scope 1-3 profile and impact tracking.
Sustainability Strategy
The best ways to reduce carbon footprint - get your science-based and tailored roadmap.
Climate Engagement
Engage and collaborate with other people inside and outside the organization.
Official Reports & Content
Official sustainability reports and badges to comply with regulations like CSRD.
Science
Official standards and methodologies.
Research
Accurate and based on scientific research.
Security
Highest data security.
HOW IT WORKS
3 steps to unlock sustainability success.
1. Analyze
Get your carbon footprint calculation in record time.
2. Impact
Implement your tailored decarbonization plan.
3. Engage
Communicate transparently and create trust.
Environmental Scientist Support
You are not alone in the process. Our experts will guide and support you in the carbon footprint calculation, making your company climate-ready and ensure you comply with all required legislation.
Why customers love what we do
FEATURED IN:
The most flexible system.
Footprint Intelligence covers a range of different projects: besides the the all-new CSRD Regulation it covers CCF (Corporate Carbon Footprint) calculation. The system is enabled for digital projects, media projects, physical products, or even custom project emissions, depending on your needs. Looking for something specifically? Get in touch with our team.
Corporate Carbon Footprint
Corporate footprint of your whole company or location.
CSRD / ESG Compliance
Simplified ESG data collection and CSRD reporting, driven by AI.
Commute Footprint
Employee commute & mobile work calculation (Scope 3 cat 7).
Impact Strategy
SBTi targets setting and impact strategy implementation.
Event Footprint
Carbon footprint calculation of your event.
Double Materiality Assessment
Evaluate financial and environmental impacts for ESG compliance.
Analyze
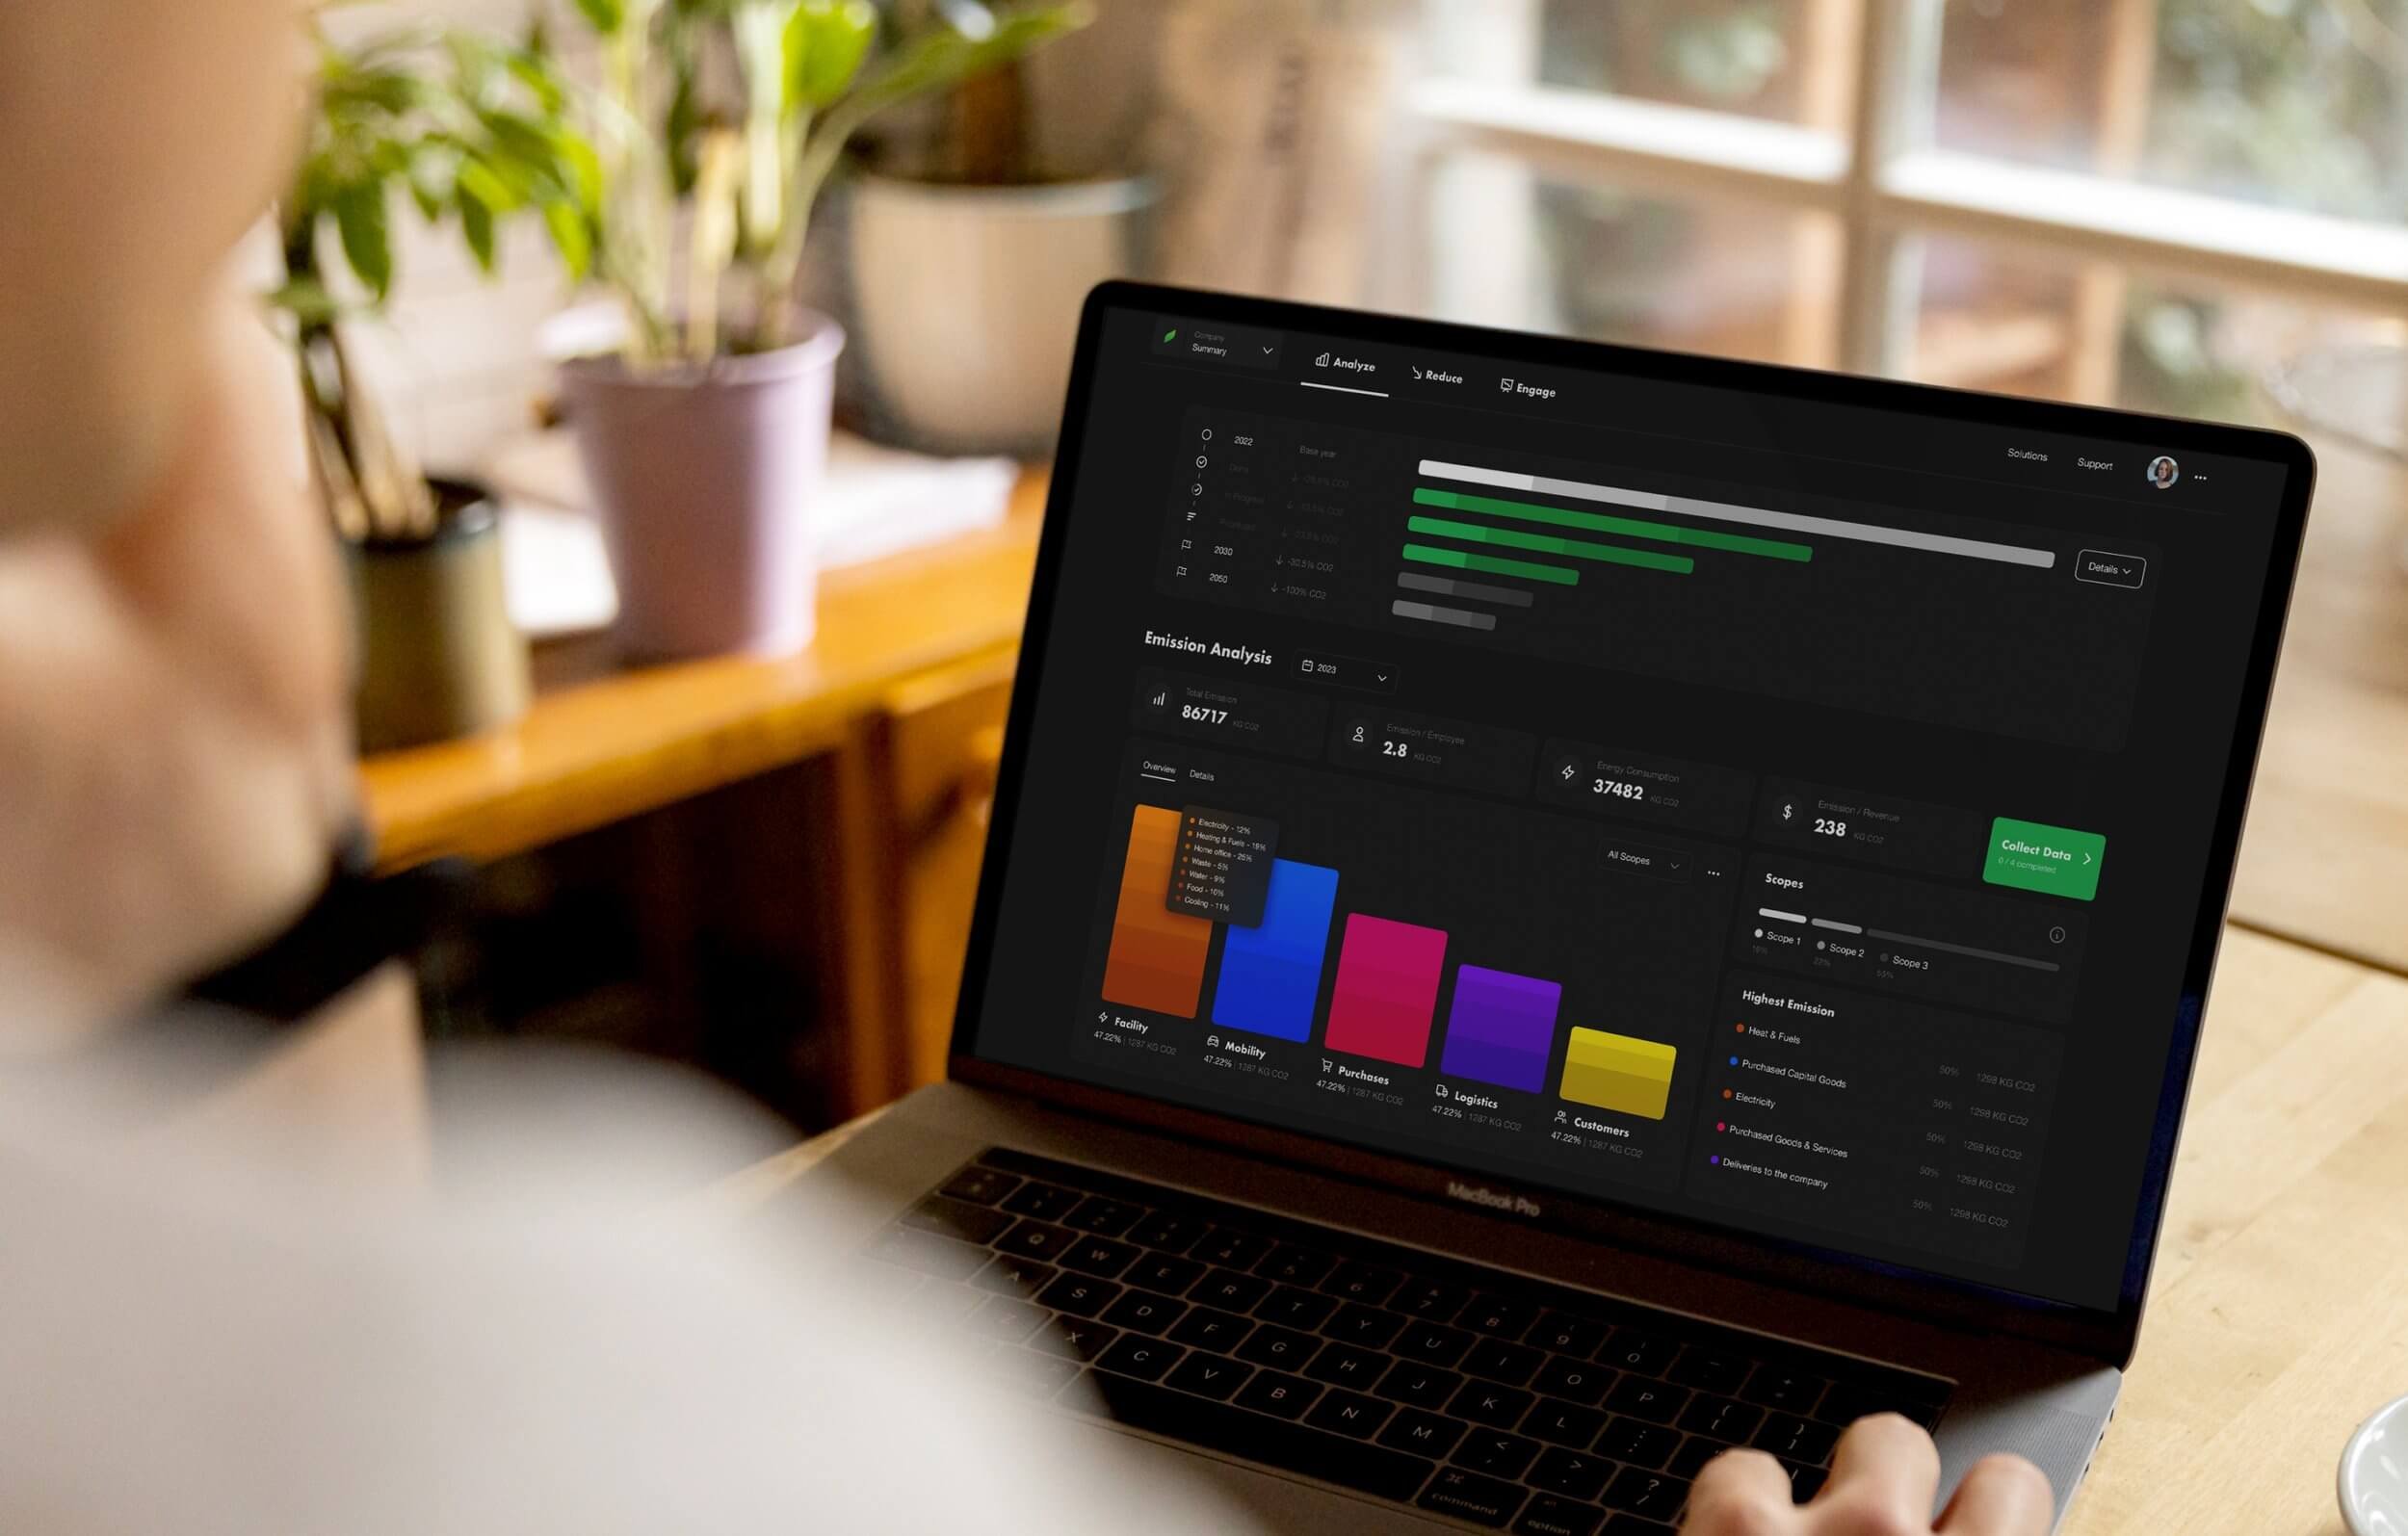
The fastest way to get an accurate carbon footprint calculation.
Collaborate with your colleagues, employees, and suppliers to get all the data required in record time. To accelerate the process, we use AI to calculate emissions faster.
Set APIs to track data or import external files such as CSV, Excel, APIs, or 3D BOM files.
Invite suppliers and employees to collaborate and add data until a certain deadline.
Use the data the way you have it and our system automatically does the conversion.
Crowdsource anonymous information from employees to manage scope 3 emissions.
Mobility Emissions
Scope 3 Employee Emissions & Education in one.
Empower employees to learn more about their emissions while gaining accurate data on your scope 3 emissions - without sharing any personal data.
Impact
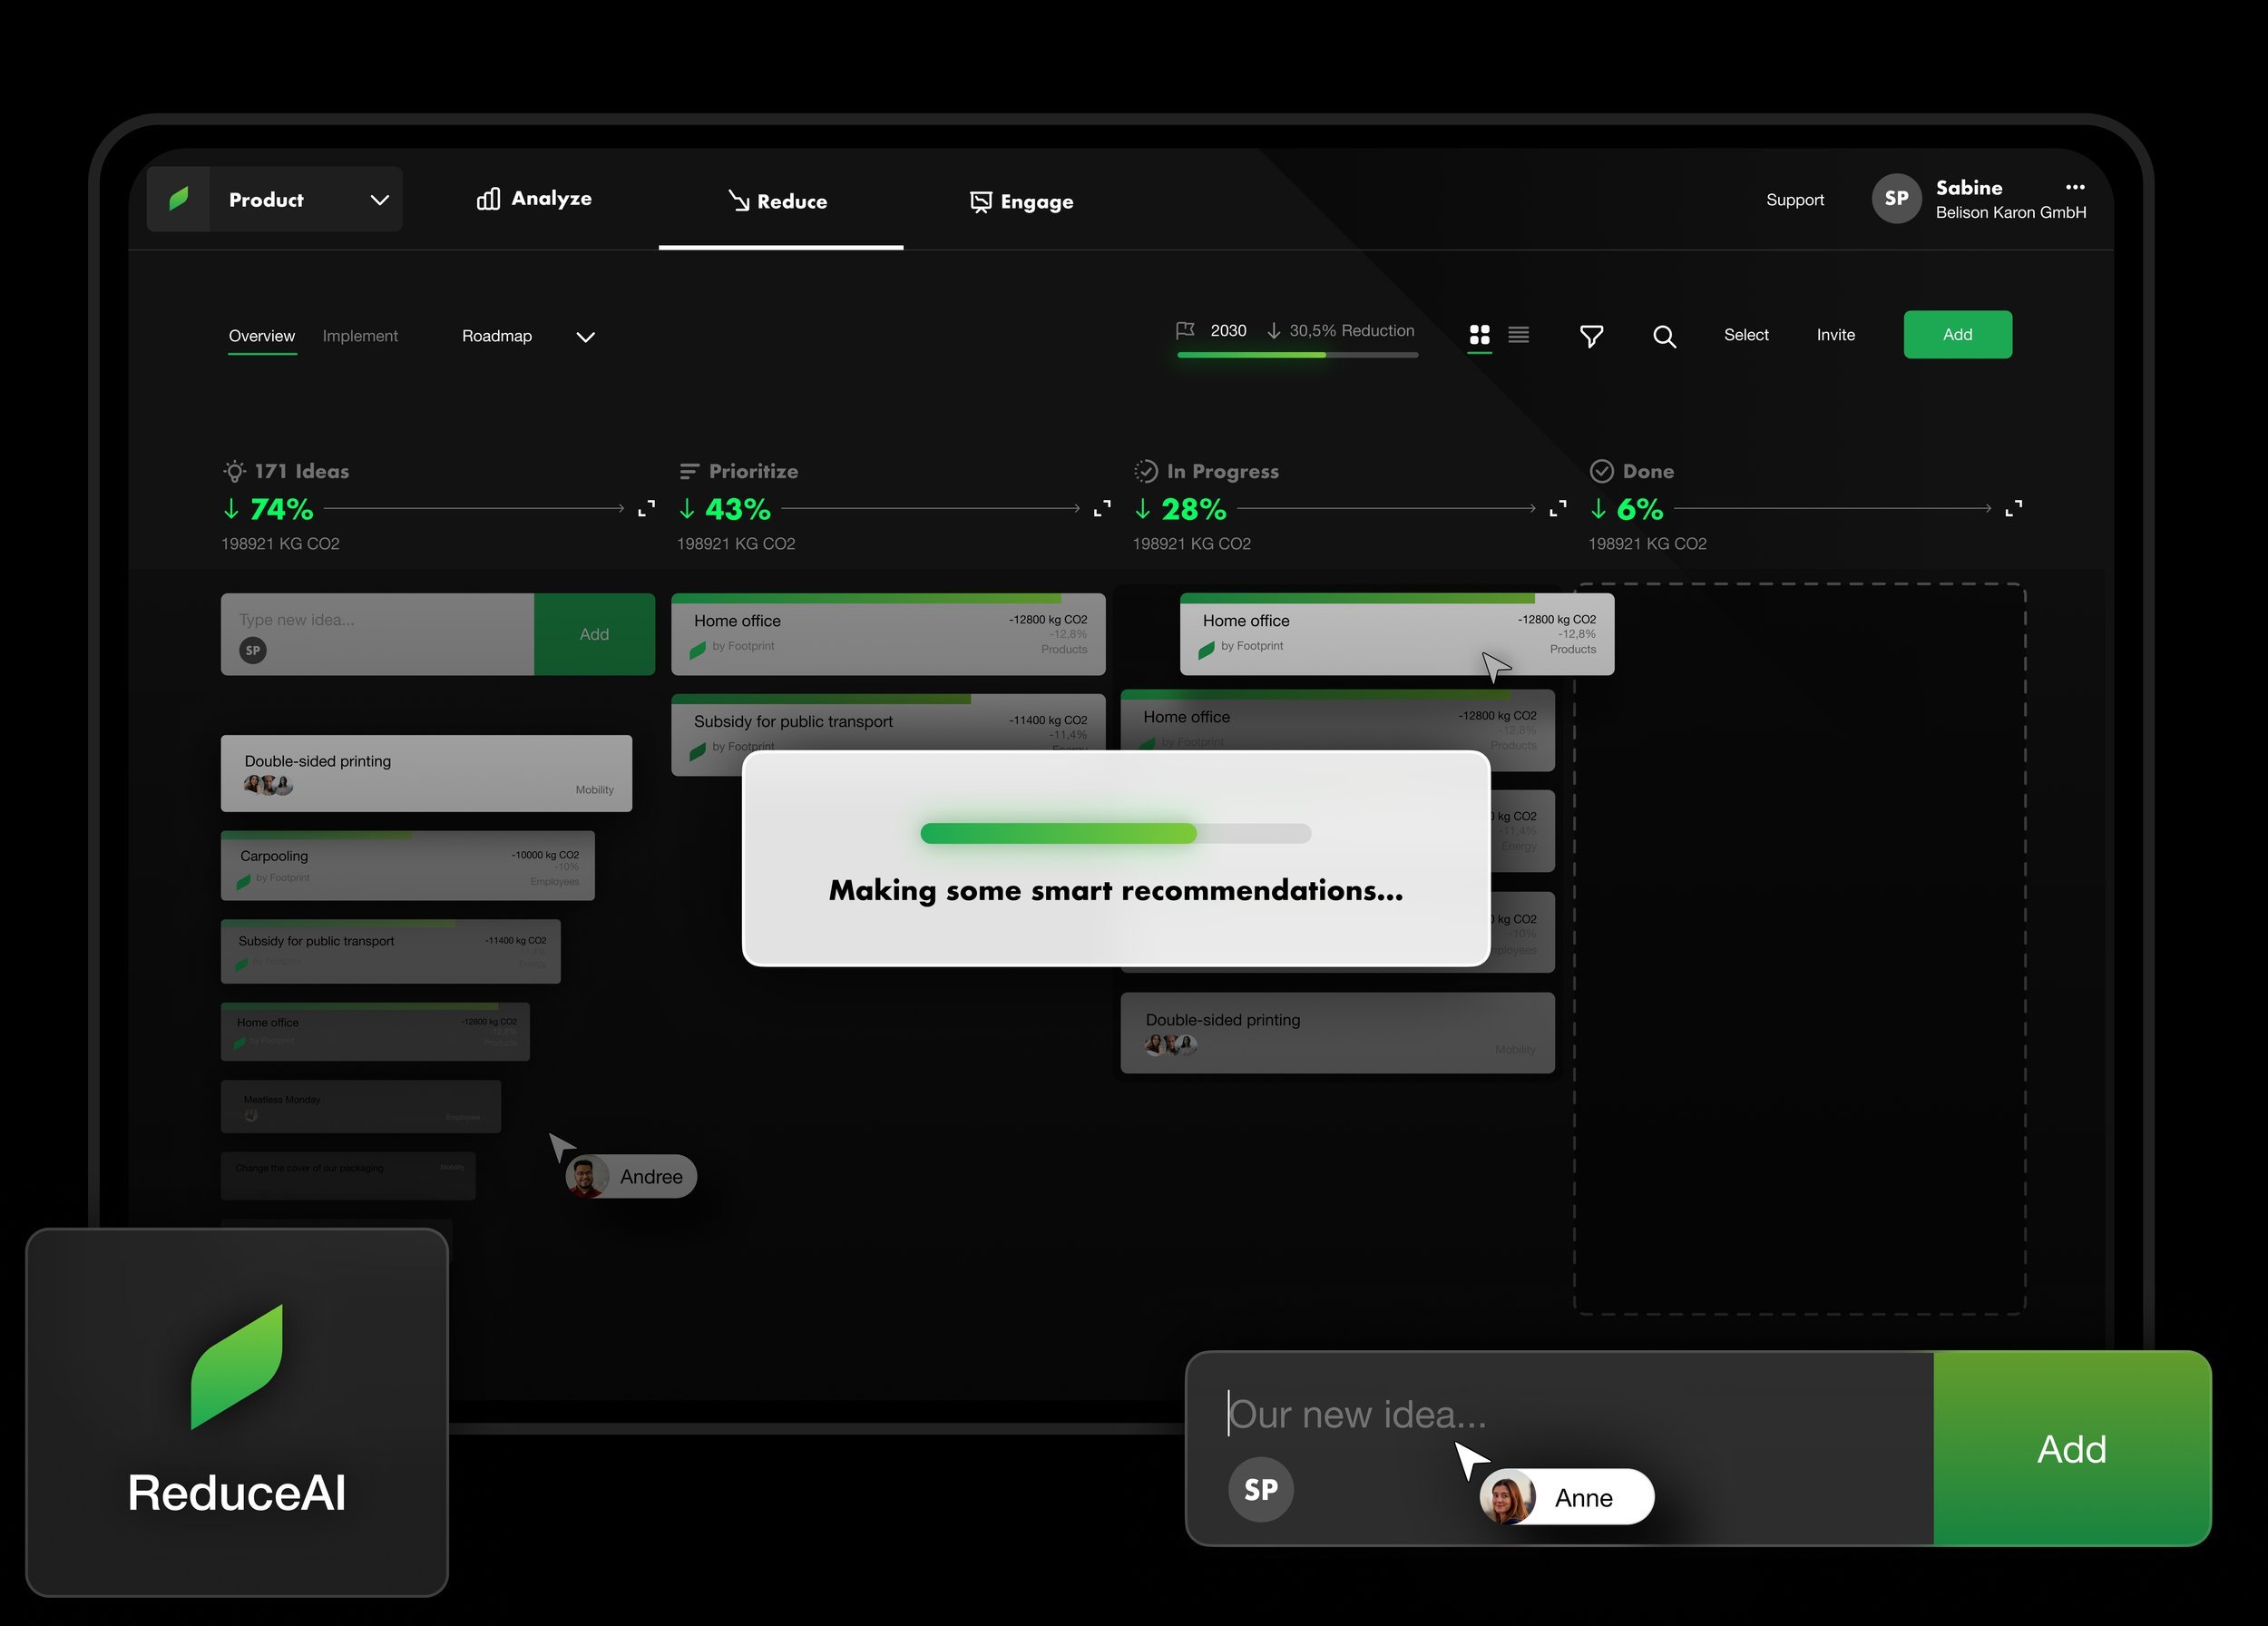
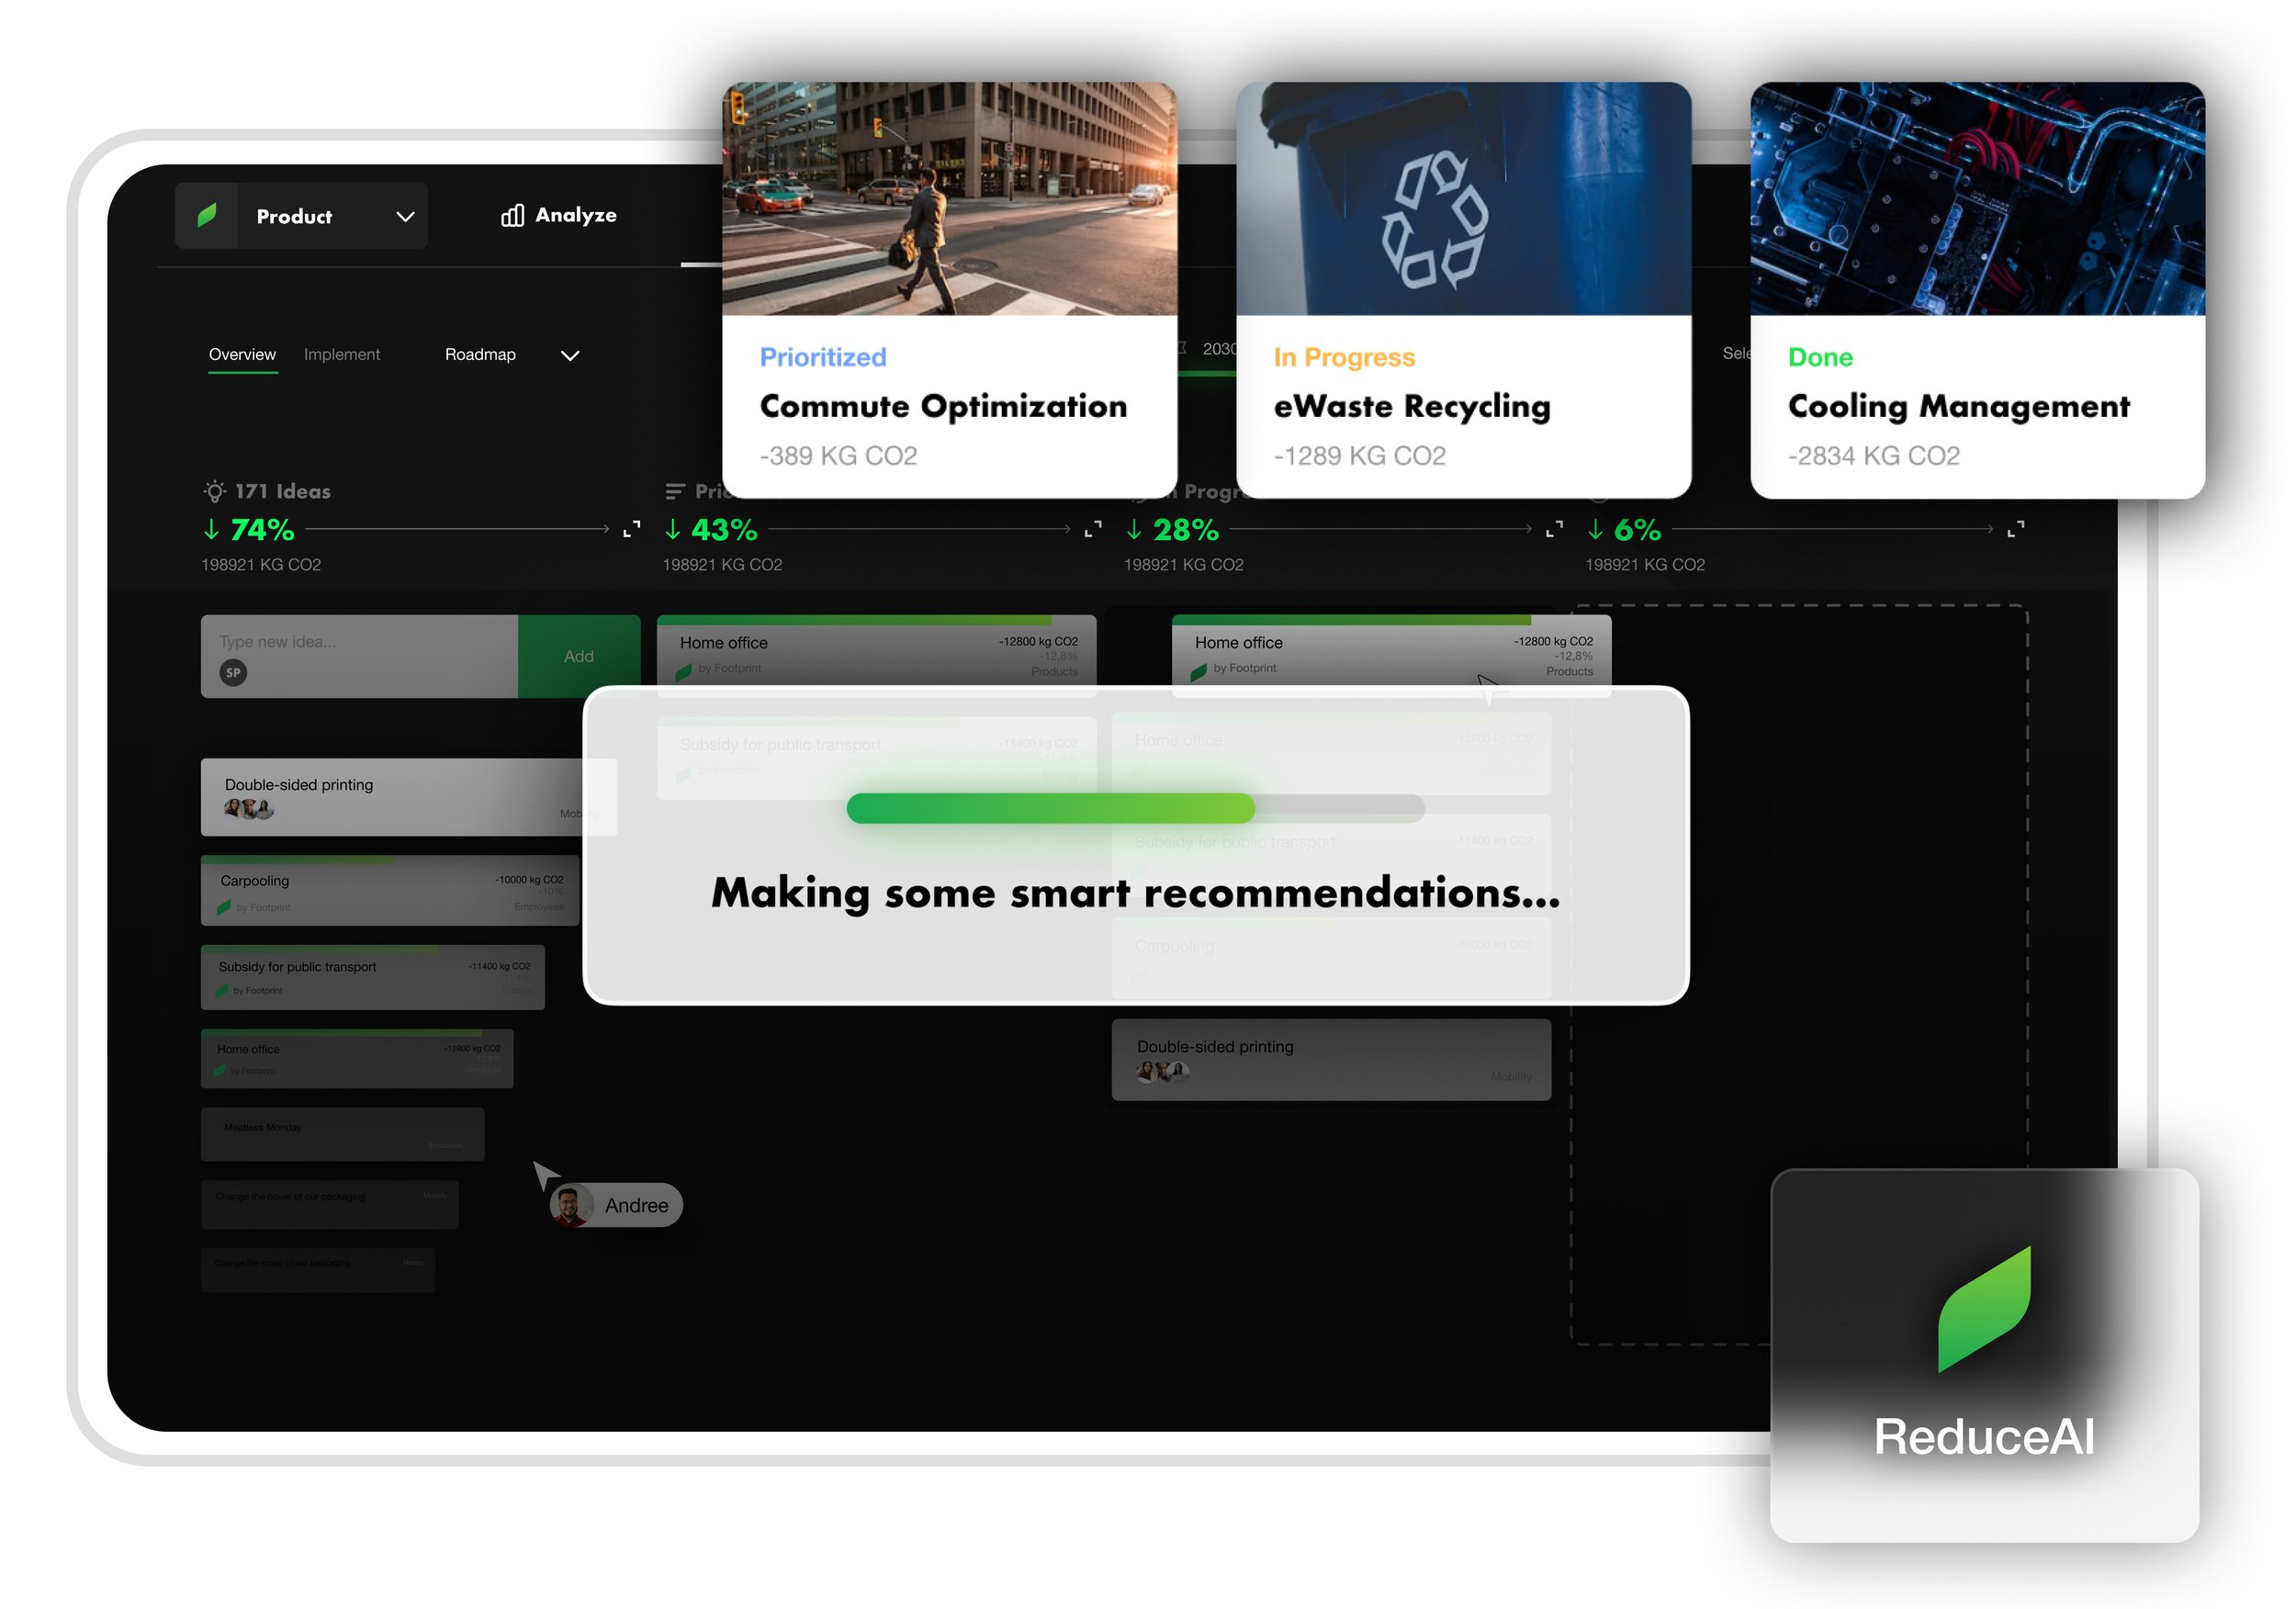
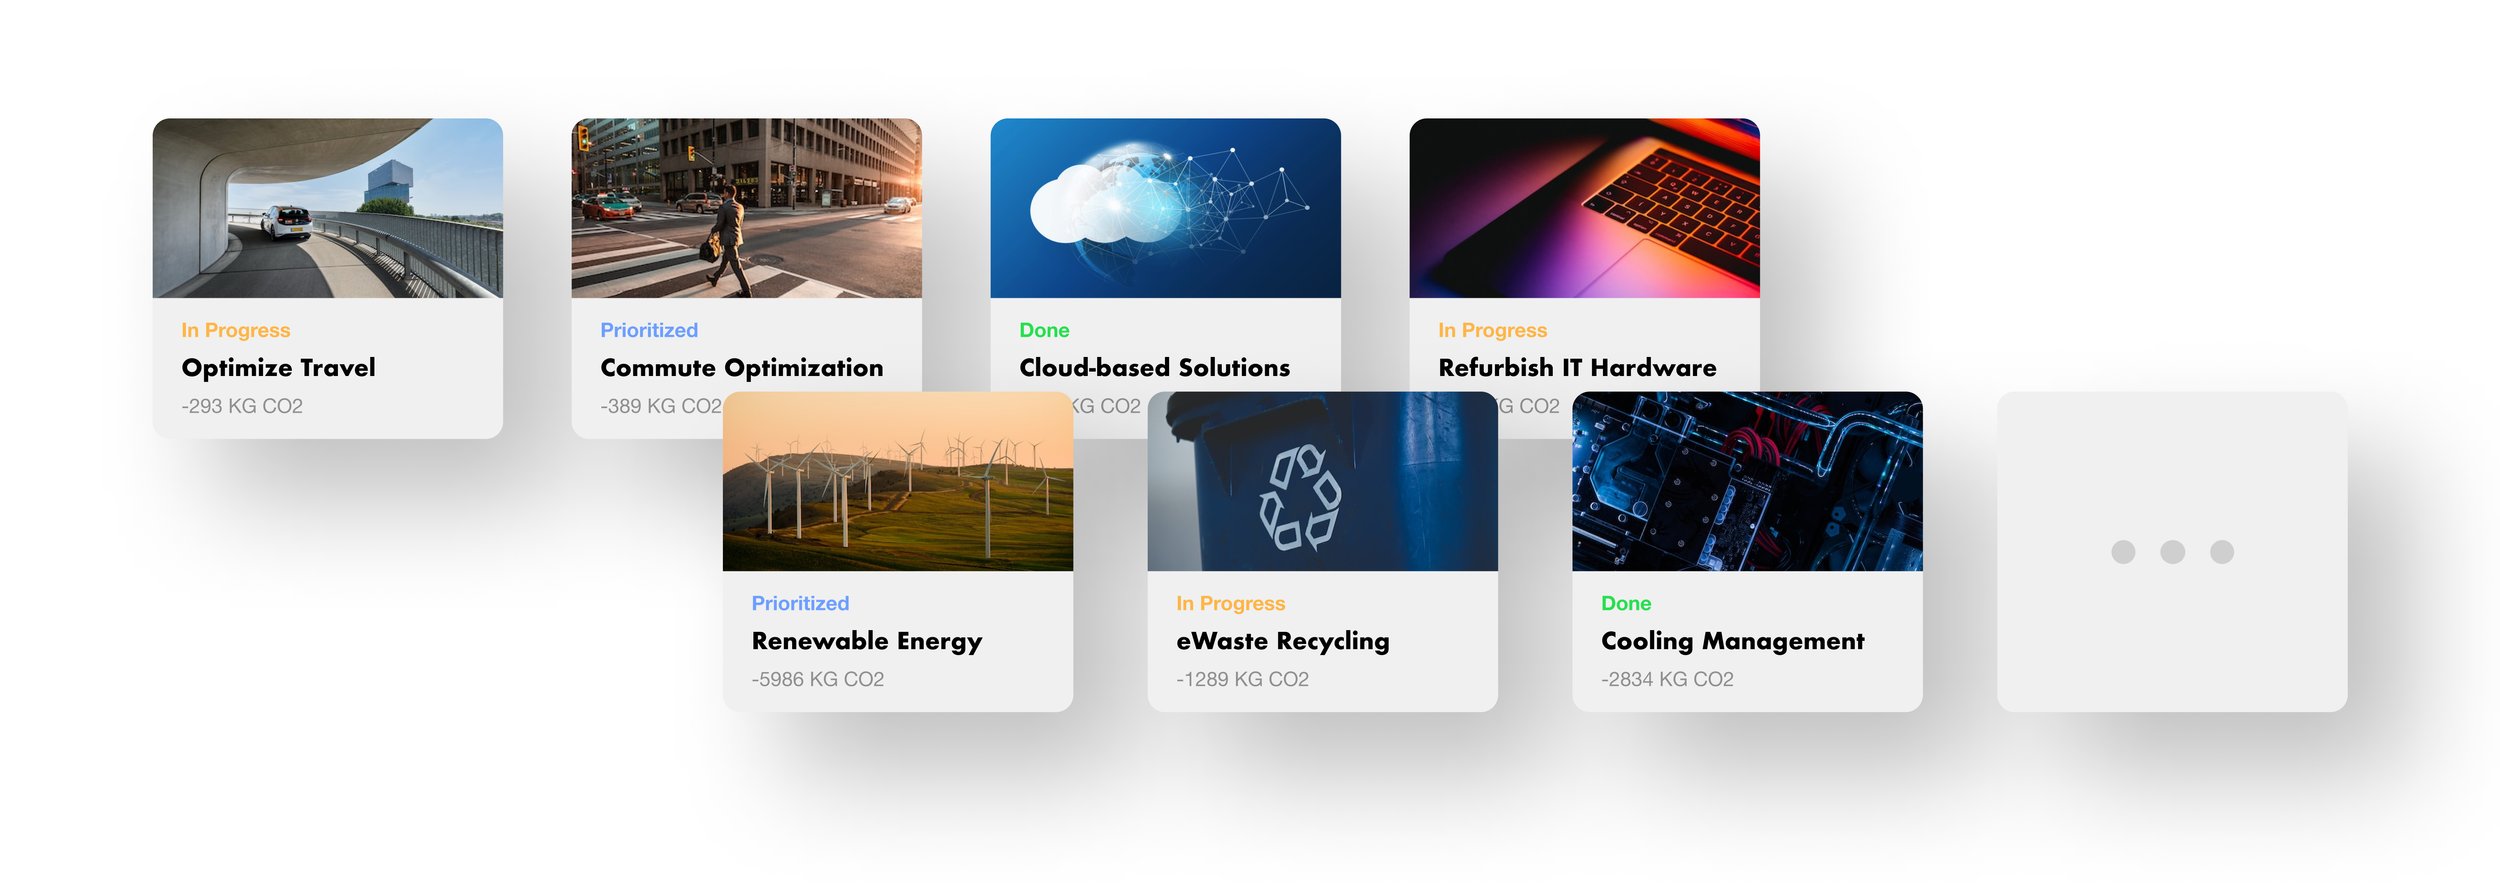
Get smart impact recommendations to reach your goals.
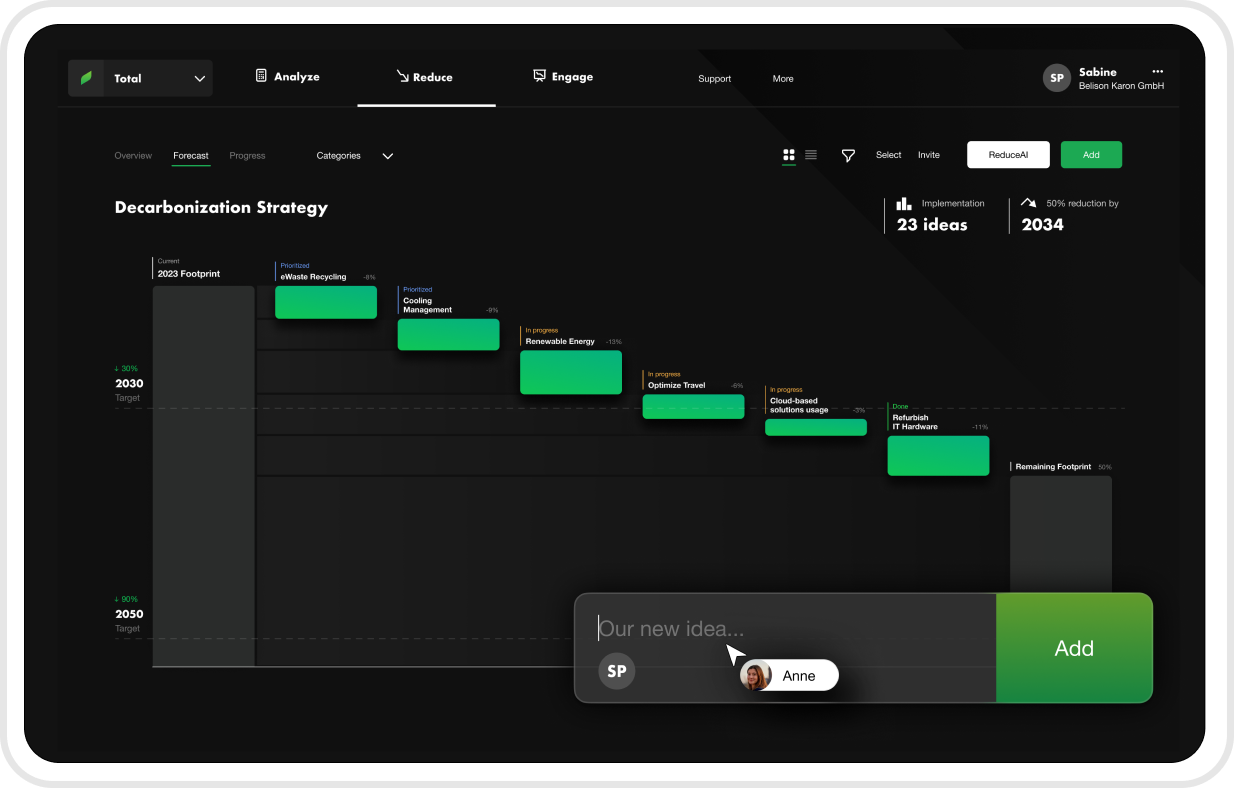
Set your sustainability goals and get automatic smart and quantified recommendations on how to reach them. Net-Zero made easy. The best ways to reduce emissions.
500+ Quantified Impact Actions
500+ Quantified Impact Actions
The world’s first quantified decarbonization AI database.
Making the right recommendation for your business.
Crowdsourcing
Get sustainability ideas from employees and clients.
Drive sustainability engagement in your organization and leverage the intelligence across your company by getting sustainability ideas from employees or clients. Get the ways how to reduce your carbon footprint.
Data-driven Decisions
Compare recommendations and plan your roadmap.
Compare ideas based on the required investment, costs/savings, efforts, communication value, or sustainability metrics like CO2e, and others - to decide how you want to reduce your carbon footprint.
Engage
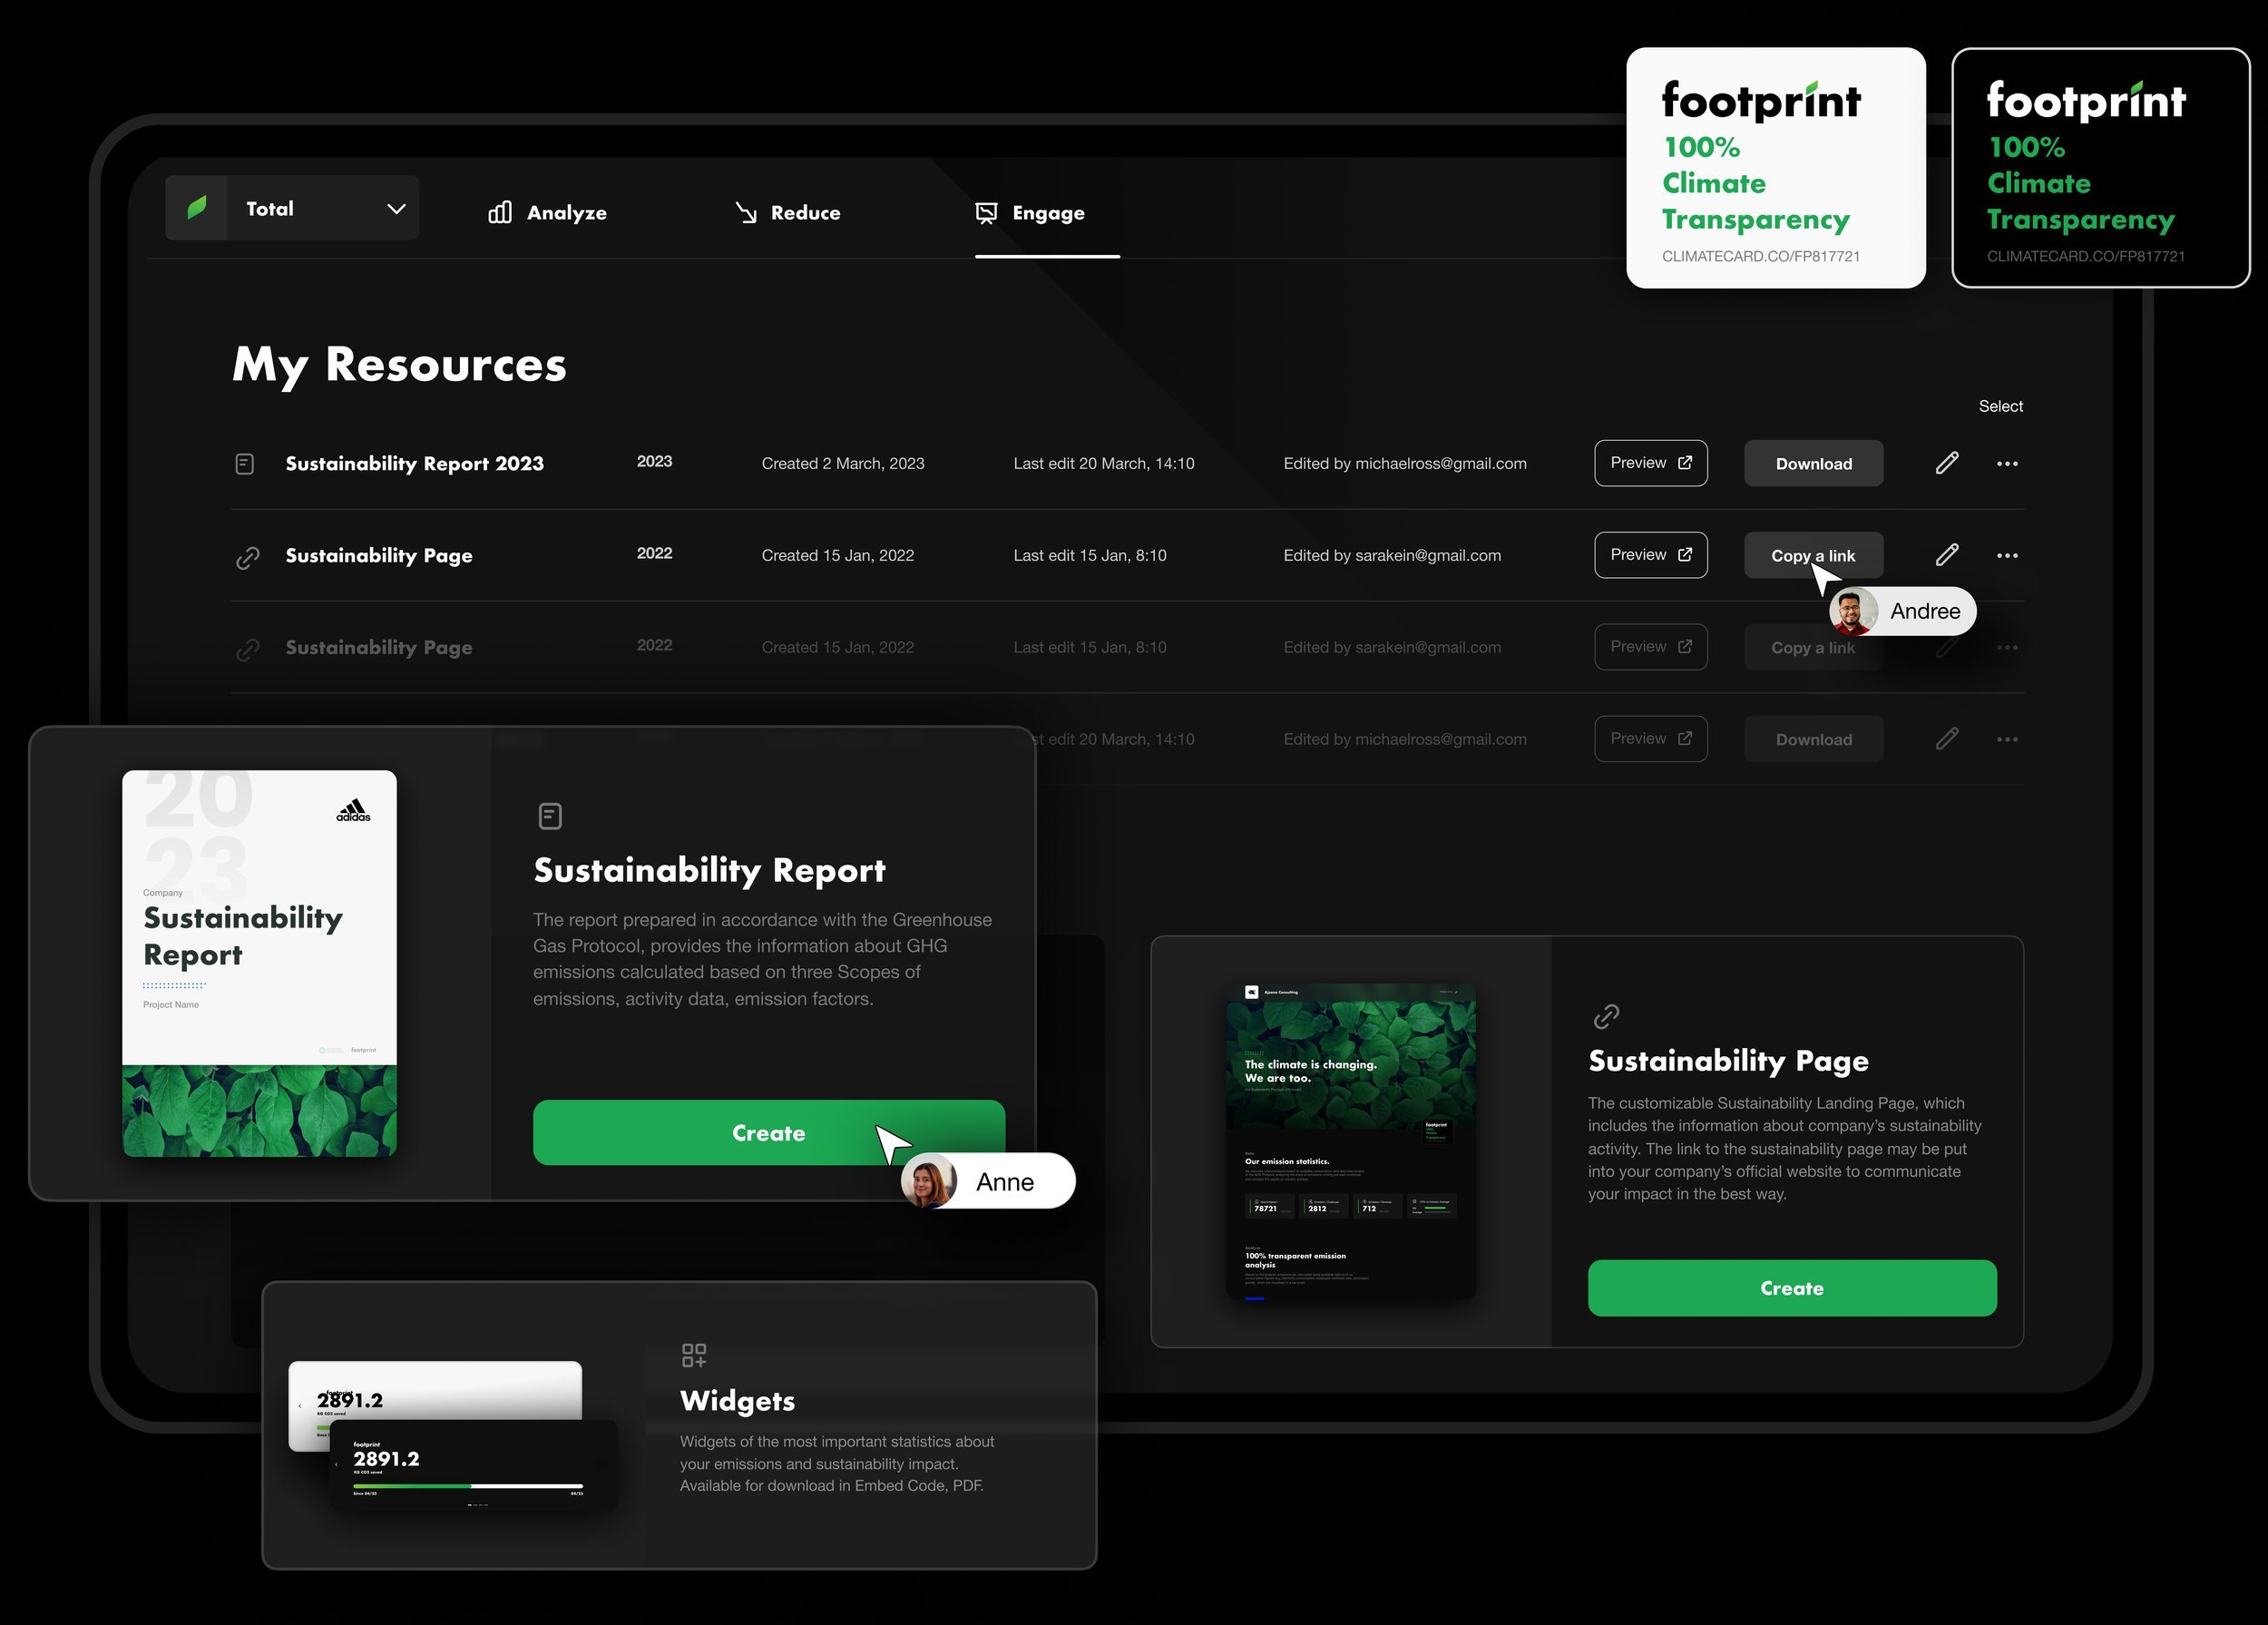
Get powerful communication resources.
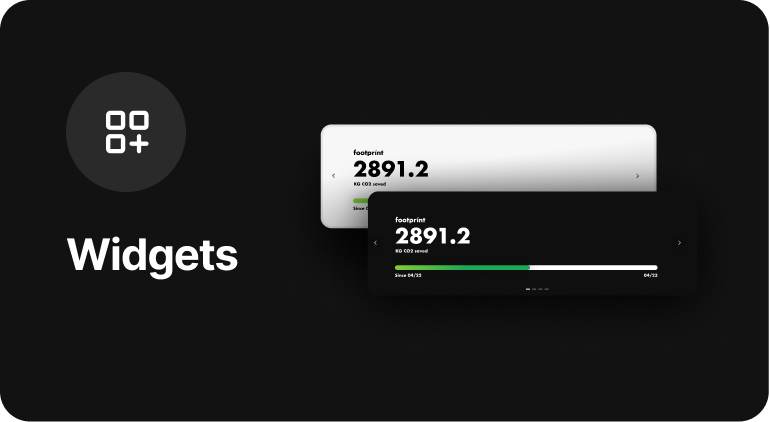
Communicate your impact without greenwashing and personalize the design of your automatic sustainability report and communication resources. Keep your climate reporting always updated with ease.
AUTHENTIC COMMUNICATION
AUTHENTIC COMMUNICATION
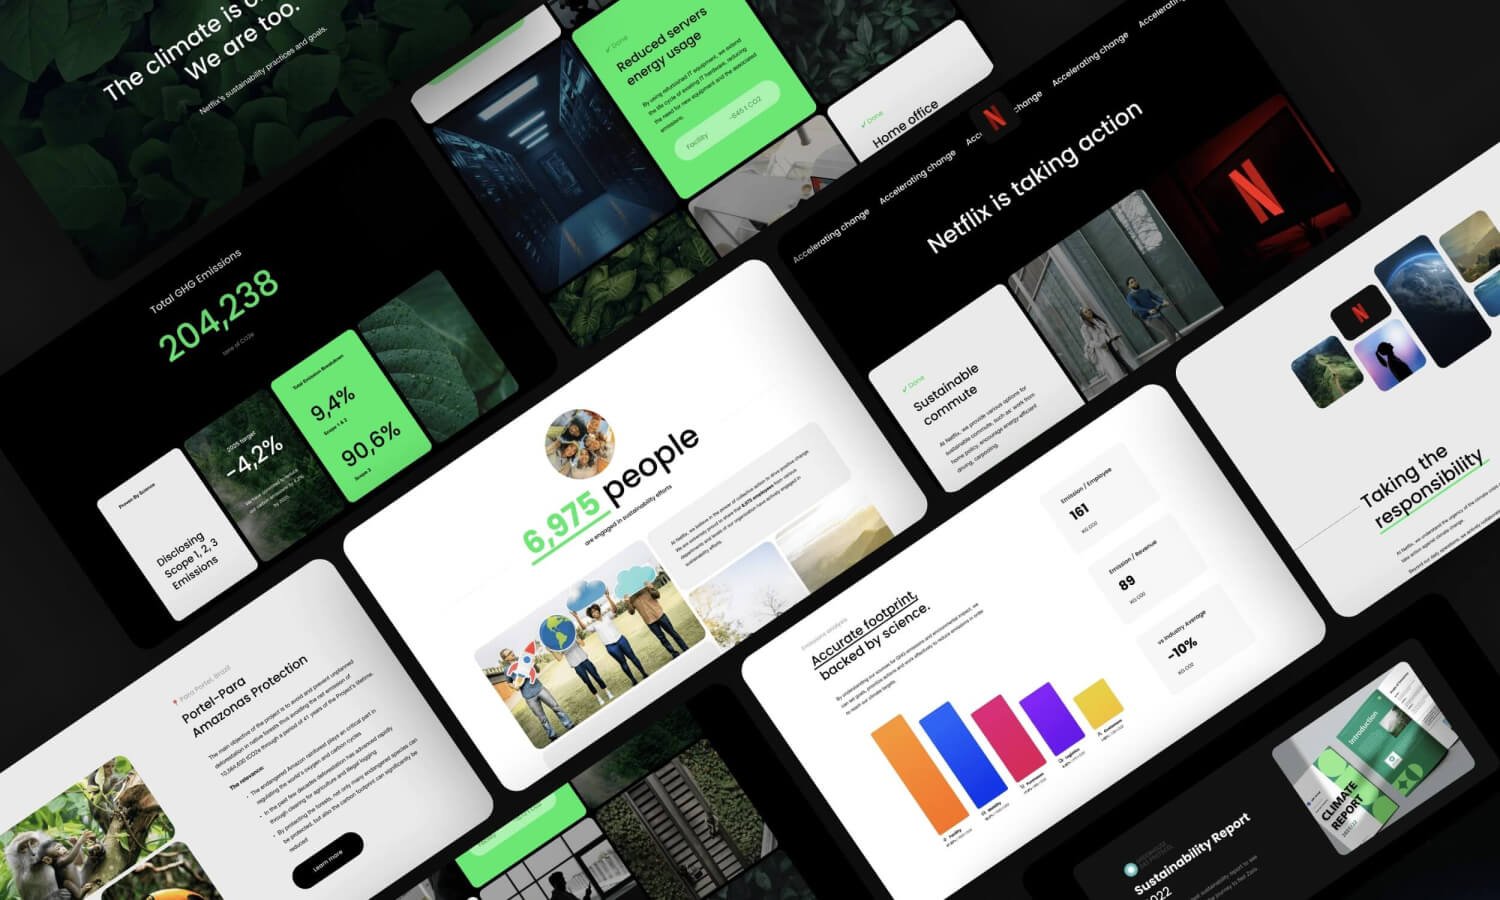
Branded Sustainability Report
Ensure compliance with a detailed sustainability report that is tailored specifically to your brand.
Branded Sustainability Page
Establish trust and credibility by fostering transparency regarding your carbon footprint and sustainability initiatives.
The smart choice
The smart choice
Footprint Intelligence
Carbon Accounting & Reporting
Specialized on Digital & Service organizations
500+ quantified decarbonization actions
Customer & Employee engagement
Implementation & Impact tracking
Other Solutions
Carbon Accounting & Reporting
Specialized on Digital & Service organizations
500+ quantified decarbonization actions
Customer & Employee engagement
Implementation & Impact tracking
Frequently Asked Questions
-
A Corporate Carbon Footprint (CCF) is the total greenhouse gas emissions from a company’s operations, including direct (Scope 1), energy (Scope 2), and supply chain and travel (Scope 3) emissions.
-
It’s essential for regulatory compliance (like CSRD), carbon reduction planning, stakeholder trust, and attracting talent. A Corporate Carbon Footprint (CCF) also demonstrates transparency to customers and investors, creating long-term competitive advantage. It serves as the baseline for any effective ESG strategy.
-
Platforms like Footprint Intelligence automate data input, map Scope 1–3 activities, and generate emissions profiles using trusted databases. This includes emissions from facilities, IT systems, employee mobility, procurement, and other business operations — giving you a complete and structured view of your corporate carbon footprint.
-
Footprint Intelligence is built for any organizational structure — from single-entity companies to complex, multi-brand holdings. You can group data by entity, location, business unit, or region, and view both granular insights and aggregated emissions summaries across your entire organization. This makes it easy to manage reporting for diverse setups, including subsidiaries, shared services, or cross-country operations.
-
Yes. Footprint Intelligence supports carbon reduction planning by modelling carbon reduction pathways across Scope 1, 2, and 3 emissions. It helps estimate costs, forecast savings, and prioritise actions based on impact and feasibility — aligned with frameworks like the Science-Based Targets initiative (SBTi).
-
Absolutely. Footprint Intelligence lets you seamlessly connect your Corporate Carbon Footprint (CCF) data to CSRD and ESG reporting — all within one platform. Emissions data is automatically structured into CSRD-compatible formats, supports external assurance, and can be synchronized with Double Materiality Assessments, and other disclosures. This ensures your sustainability reporting is accurate, audit-ready, and fully aligned with regulatory standards.


